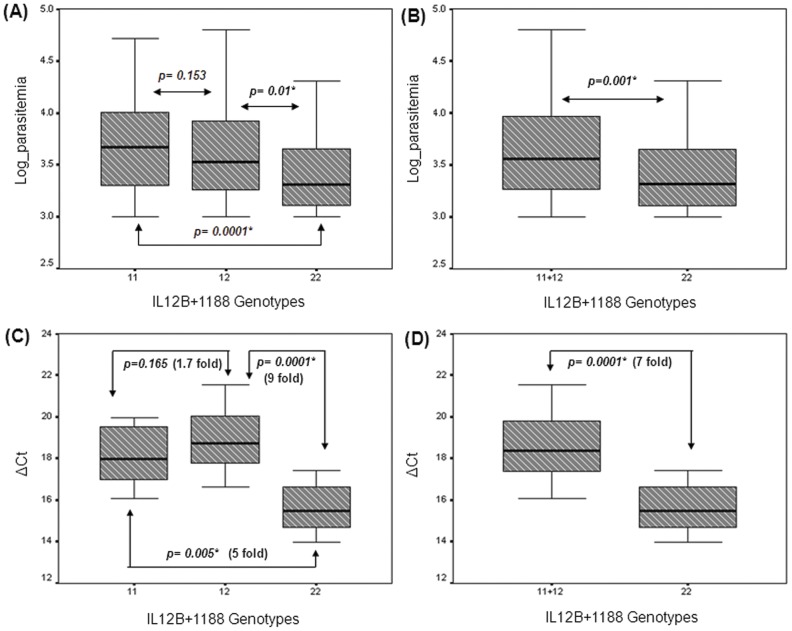
Figure 1. Association between IL12B+1188 genotypes with blood infection level and IL12B gene-expression represented in Box plots.
(A) Diagram represented the distribution of log-parasitemia across three genotypes: 11 (AA), 12 (AC) & 22 (CC) and (B) Diagram represented the comparison of log-parasitemia of minor homozygous genotype (CC) with AA and AC genotypic groups pooled. Statistical significance between pairwise comparisons was mentioned. (C) The ΔCt distribution of IL12B gene expression across AA (N = 24), AC (N = 28) and CC (N = 12) genotypes and (D) comparison of gene expression between IL12B+1188CC genotype and with that of AA and AC individuals pooled together determined by quantitative real time PCR. Statistical significance was determined by the Mann Whitney U test. P values and fold changes obtained for each pairwise combination were appended in each plot. (*) indicates these differences to be statistically significant. The bottom, middle line, and top of each box correspond to the 25th percentile, median, and the 75th percentile, respectively. Bars extend to the lowest value and to the highest value of each group.

