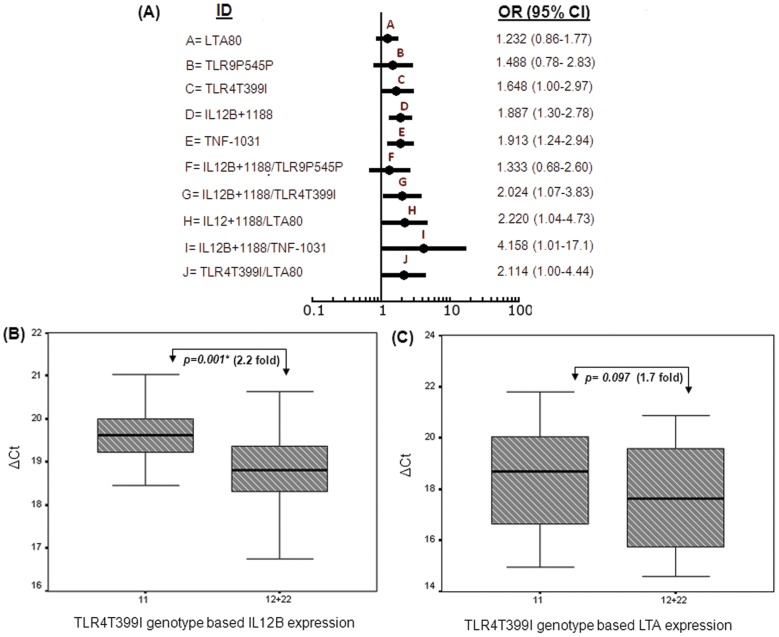
Figure 2. Genetic and functional association of multifactor models obtained by Multifactorial Dimensionality Reduction analysis.
(A) Forest plots presented the comparison of risk estimates in terms of odds ratio (OR) and 95% confidence interval (CI) for significant gene-gene interaction models and component single loci. The risk corresponding to each single and two factor models was denoted by a dot and the horizontal lines represented odds ratio and 95% CI respectively. The model IDs (A–J) and respective ORs (95% CI) were given at the left and right side of each dot in the forest plot. (B) IL12B and (C) LTA gene expression in patients' PBMCs classified according to TLR4Thr399Ile genotype status by real time quantitative PCR. Distribution of ΔCt was plotted and compared between the genotypic groups. Statistical significance was determined by Mann Whitney U test. P values and corresponding fold changes obtained for each pairwise comparison were shown in the box plots. (*) indicates these differences to be statistically significant.

