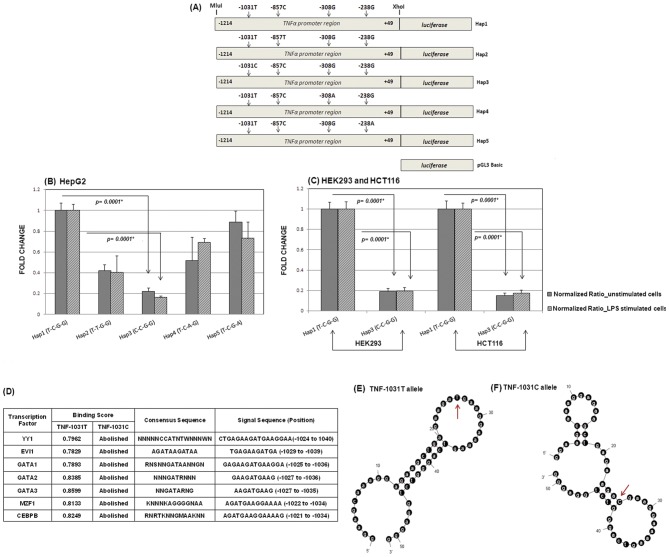
Figure 3. Results of TNF-α promoter assay.
(A) Schematic representation of reporter gene constructs for five TNF-α promoter haplotypes (Hap1–Hap5) used for transfection assays. (B) HepG2 cells (1×10⁵ cells/ml) were transiently transfected with all promoter constructs and relative luciferase activities in supernatants were measured alone (light grey) or with cells stimulated with 250 ng/ml of LPS (dark grey) after 48 hours. Activity of wild-type promoter haplotype TNF-α-Hap1 served as reference and set at one, and the variant constructs were expressed as fold changes in relation to this. Statistical significance for all pairwise comparisons was done by t-test. P values of significant differences between haplotype expressions were marked with asterisks (*). (C) Similar experiments were performed with wild-type Hap1 and variant Hap3 constructs in HEK293 and HCT116 cells and corresponding differences in promoter activities were measured. (*) indicates the significant comparisons given as P values. (D) Putative transcription factor binding profiles for TNF-1031 T allele summarizing the TFs with their binding scores, consensus and signal sequences which were completely abolished in presence of the variant (C) allele. (E & F) MFOLD derived representative DNA secondary structures encompassing 50 bp TNF-α promoter sequence. The numbers indicate the base position while the arrowhead marks the −1031 site.

