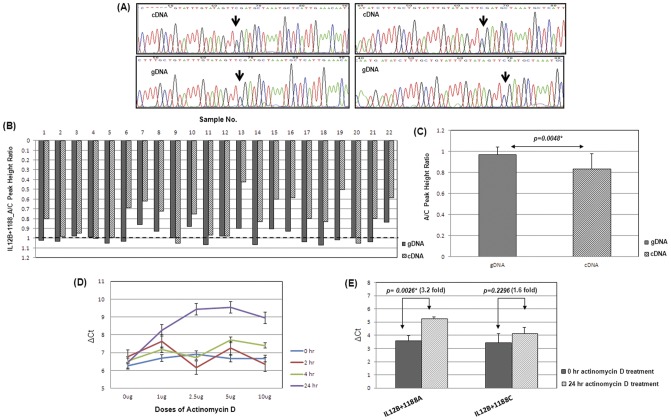
Figure 4. IL12B 3′UTR based AEI analysis.
(A) Representative electropherograms showing the peak heights of the sequence encompassing IL12B+1188 locus in gDNA (lower panel) and cDNA (upper panel) extracted from the heterozygous (AC) patients' PBMC samples. The arrowhead indicates the +1188 site. Here A and C alleles are represented as green and blue peaks respectively. Difference in peak heights in sequences between cDNA and gDNA was evident. (B) Bar graph displays the A/C peak height ratios in individual heterozygous samples (N = 22). The dotted line indicates the baseline where the A/C ratio is one. (C) The departure of A/C peak height ratios from baseline in gDNA and cDNA were shown in the form of bar diagram. Each bar represents the mean height and corresponding standard deviation. The statistical difference of this distribution was measured by Sign test. P value has been indicated. (D) Dose-response and time-course assay of actinomycin-D treatment by real time PCR. (E) HepG2 cells (1×10⁵cells/ml) were treated with the optimum dose of actinomycin-D (5 µg/ml), harvested after 0 and 24 hours after treatment and IL12B mRNA levels were measured and corrected for GAPDH mRNA for both the wild-type and variant pSiCHECK2-3′UTR constructs. Statistical significance was measured by t-test. (*) indicates the P values to be statistically significant.

