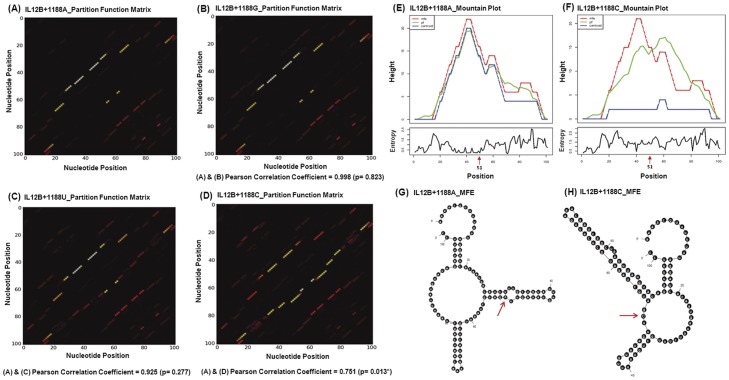
Figure 6. IL12B 3′UTR polymorphism based RNA ensemble structures.
(A–D) display the SNPfold derived partition function heat maps generated for 101 nucleotide sequences harboring A (risk), G, U and C (non-risk) alleles respectively at the 51st position. The partition function matrix illustrates the base-pairing probabilities represented by dots. We estimated the pairwise Pearson correlation coefficient with respect to wild-type A allele and P values to quantify the overall modulation in the RNA structural ensemble caused by a mutation. (*) indicates the P value to be statistically significant. (E & F) show the mountain plot diagrams for IL12+1188A and C allele for 101 bases using RNAfold. The upper panel demonstrates the height vs position graph in which the red, green and blue lines depict the minimum free energy structure, the partition function of all possible RNA secondary structures and ensemble centroid structure respectively. The lower panel represents the entropy vs position profile and arrowhead denotes the 51st position, the location of A+1188C. (G & H) shows allele specific minimum free energy (MFE) conformations generated from RNA MFOLD. Numbers indicate the base position while the arrow directs the position of the polymorphic site.

