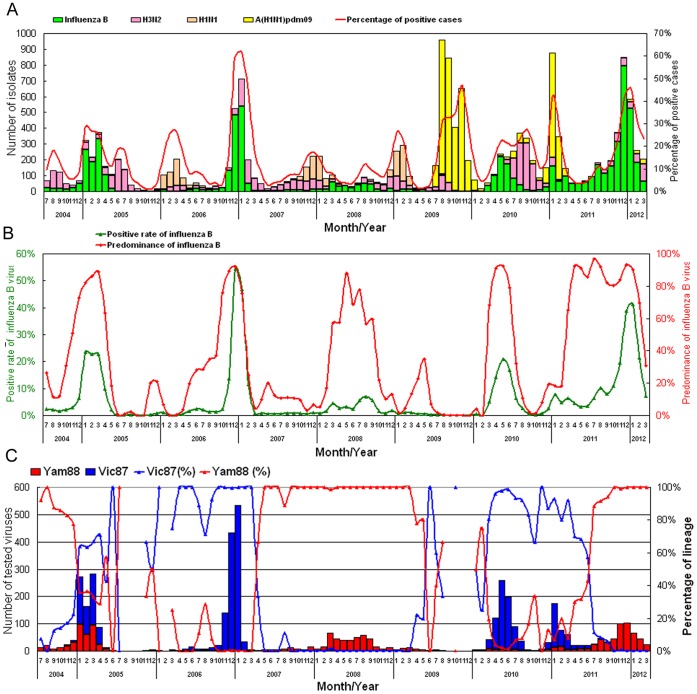
Figure 1. Data from the laboratory-based surveillance network in Taiwan from 2004 to 2012.
(A) The monthly distributions of the influenza isolates, including A(H1N1), A(H3N2), A(H1N1)pdm09 and influenza B viruses, are shown as bars. Positive rates of confirmed cases are also shown in the line chart. (B) The dynamic changes in influenza B activity. The monthly positive rates of influenza B represent the percentage of confirmed influenza B cases among all reported and tested cases in a specific month. The predominance of influenza B was calculated by dividing the number of all influenza viruses by the number of confirmed influenza B viruses. (C) The lineage distribution of influenza B viruses. The Victoria (Vic87) and Yamagata (Yam88) lineages isolated from 2004 to 2012 were classified based on their HA genes. The numbers of influenza B viruses analyzed each month are shown as bars, and the monthly ratio of each lineage is shown as a line chart.

