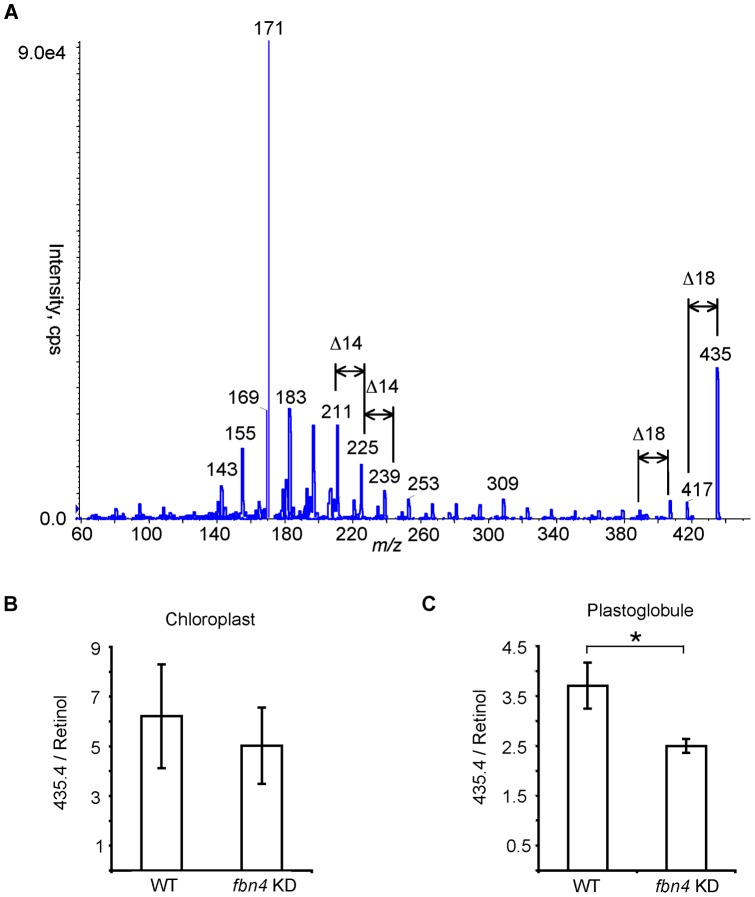
Figure 4. Analyte at m/z 435.
(A) MS/MS analysis. Abundance in WT and fbn4 KD lipid extracts from chloroplasts (B) and plastoglobules (C), normalized to retinol. Data are means ± SD of three measurements; *, P<0.05 using Student's t test. Similar results were obtained in two biological replicates for the chloroplasts and three biological replicates for the plastoglobules.

