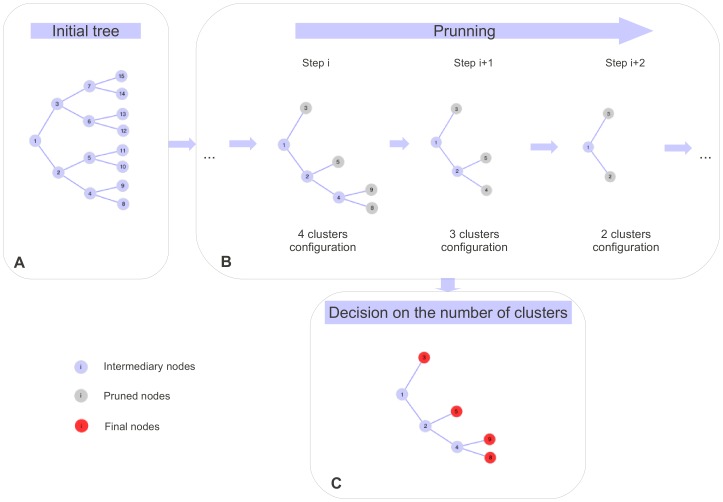
Figure 1. Graphical example of the SHIPS algorithm.
After that the initial binary tree is built, the pruning procedure leads at the end of each step to a possible clustering of the individuals. In this example the data is clustered in four, then three then two clusters (gray nodes) at step i,  and
and  respectively. The final clusters decided by the gap statistic correspond to the ones of the four classes clustering (red nodes).

