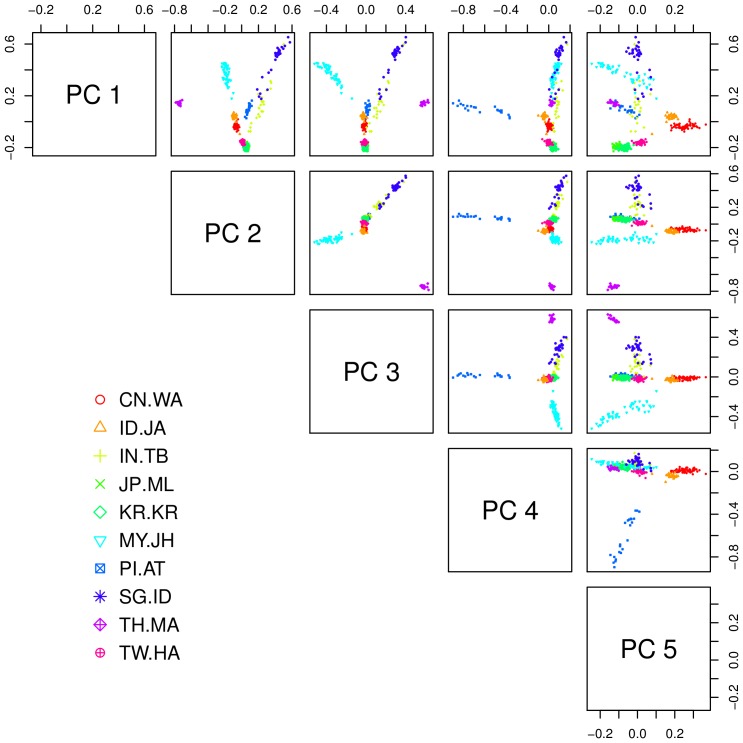
Figure 4. Representation of the 10 populations of the Pan-Asian dataset.
This scatter-plot uses the first five principal components of a dataset with 20 K SNPs. This graph is only intended to present the general genetic pattern of the dataset and does not exhaustively represent the capability of the PCA to separate the populations.

