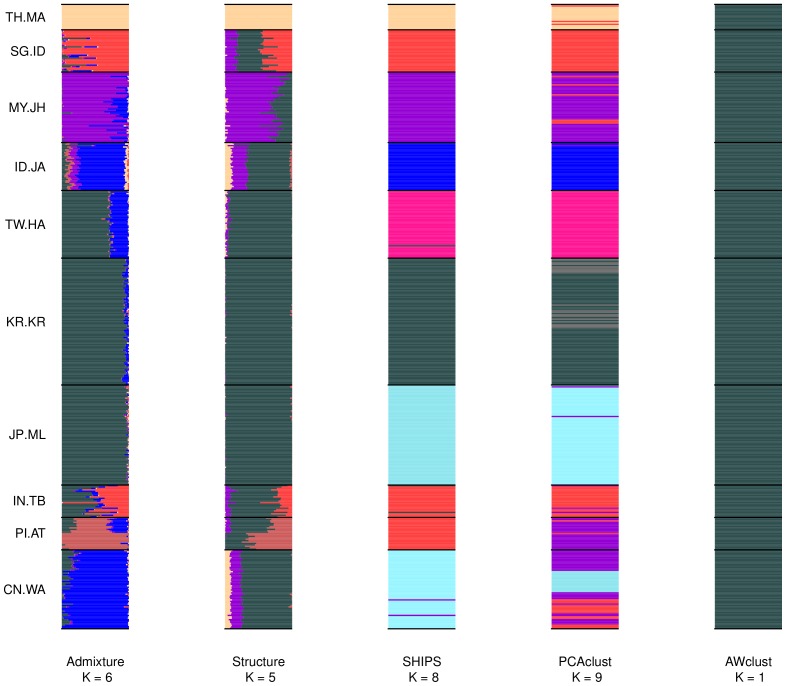
Figure 9. Barplots of the admixture proportions for the small Pan-Asian data.
The first small dataset was used to produce this plot. Populations are separated by black lines and assigned with a unique color that is approximatively reported on the barplot of each method. For the discrete methods the admixture proportions are either 0 or 1.

