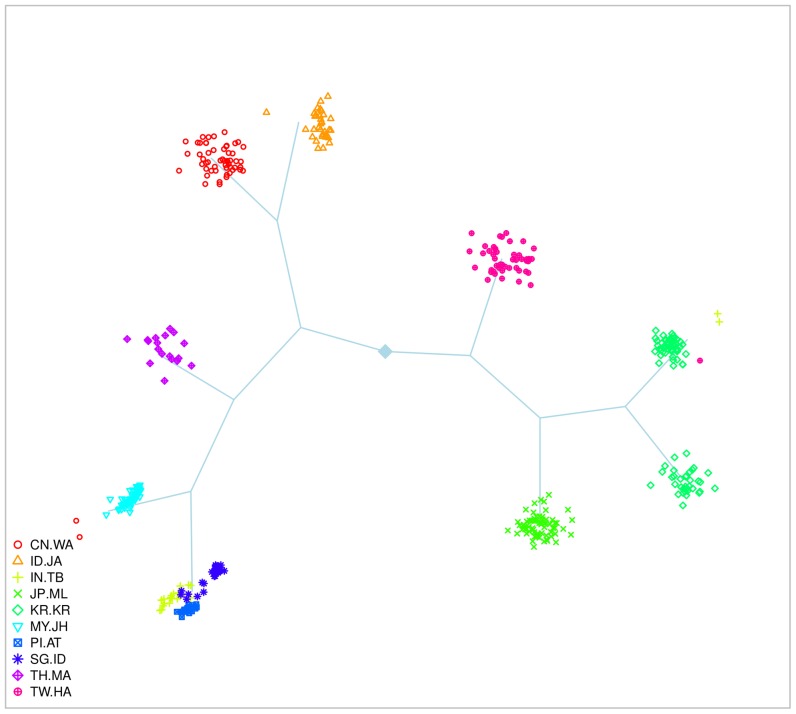
Figure 11. SHIPS tree of the 10 Pan-Asian populations.
This representation is an output produced by SHIPS. The tree structure corresponds to the successive divisions conducted by the algorithm. Each final cluster is represented by a scatter-plot of its members. We colored here the individuals according to the population labels.

