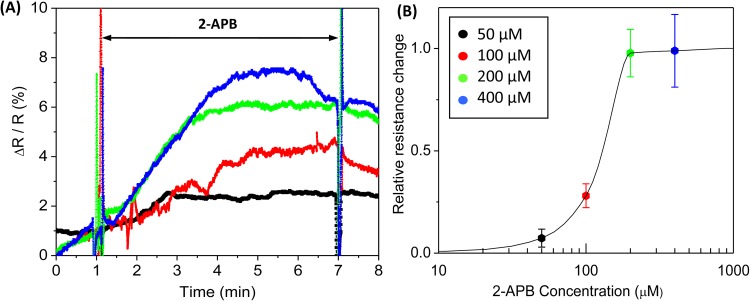
Figure 4.
Dose dependent 2-APB inhibition. (a) Representative changes in resistance measured in the presence of 50 μM (black), 100 μM (red), 200 μM (green), and 400 μM (blue) 2-APB. The change in resistance (ΔR) was normalized to the baseline resistance (R) with a stable gap. (b) Concentration dependence of normalized maximum resistance change showing the saturation of 2-APB inhibition at 200 μM (50 μM (n = 5), 100 μM (n = 6), 200 μM (n = 8), and 400 μM (n = 9)). The error bars are the standard errors.

