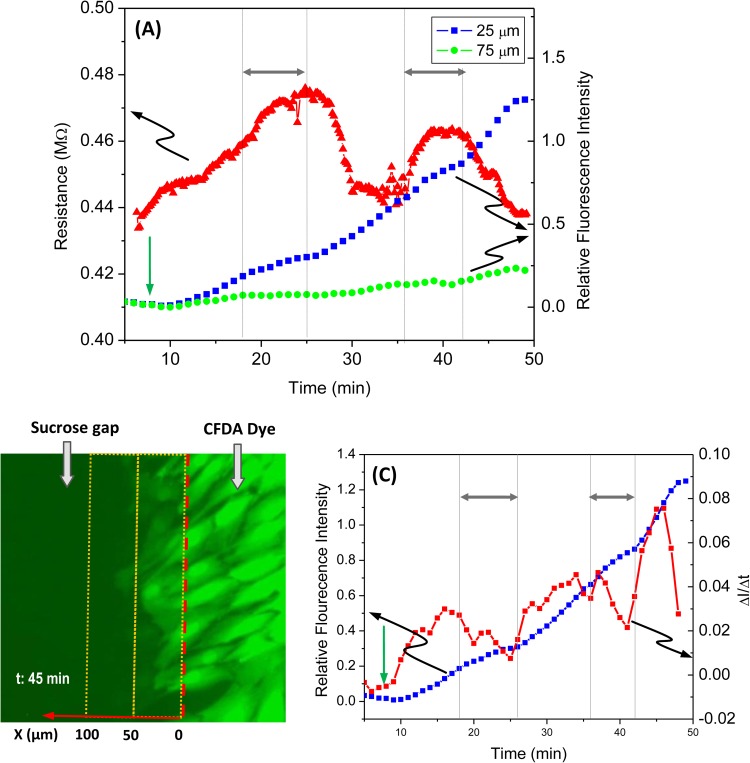
Figure 5.
Simultaneous measurement of the electrical coupling and dye diffusion in response to application of 400 μM 2-APB. (a) Time course of changes in resistance (red triangle, left axis) and the fluorescence intensity (blue square and green dots, right axis), showing that both conductance and dye diffusion was inhibited by 2-APB. The drug (400 μM 2-APB) was applied to the central stream during the periods indicated by double headed arrows in (a). For diffusion, CFDA (5 μM) was loaded to the right side solution at the time indicated by green arrow in (a). (b) Fluorescent image showing the boundary (red dashed line) between the dye loading stream (right side) and the central stream (left side). The fluorescence intensity was measured from two windows (yellow outlined in b) centered at 25 and 75 μm from the boundary in the gap region. (c) Derivative of the fluorescence intensity at 25 μm with respect to time (red square, right axis), showing that 2-APB diminished the changes in dye intensity. The change in fluorescence intensity at 25 μm (blue squares) is also plotted for comparison. The data show higher sensitivity of the electrical measurement compared to the diffusion measurement.

