
FIG 2.
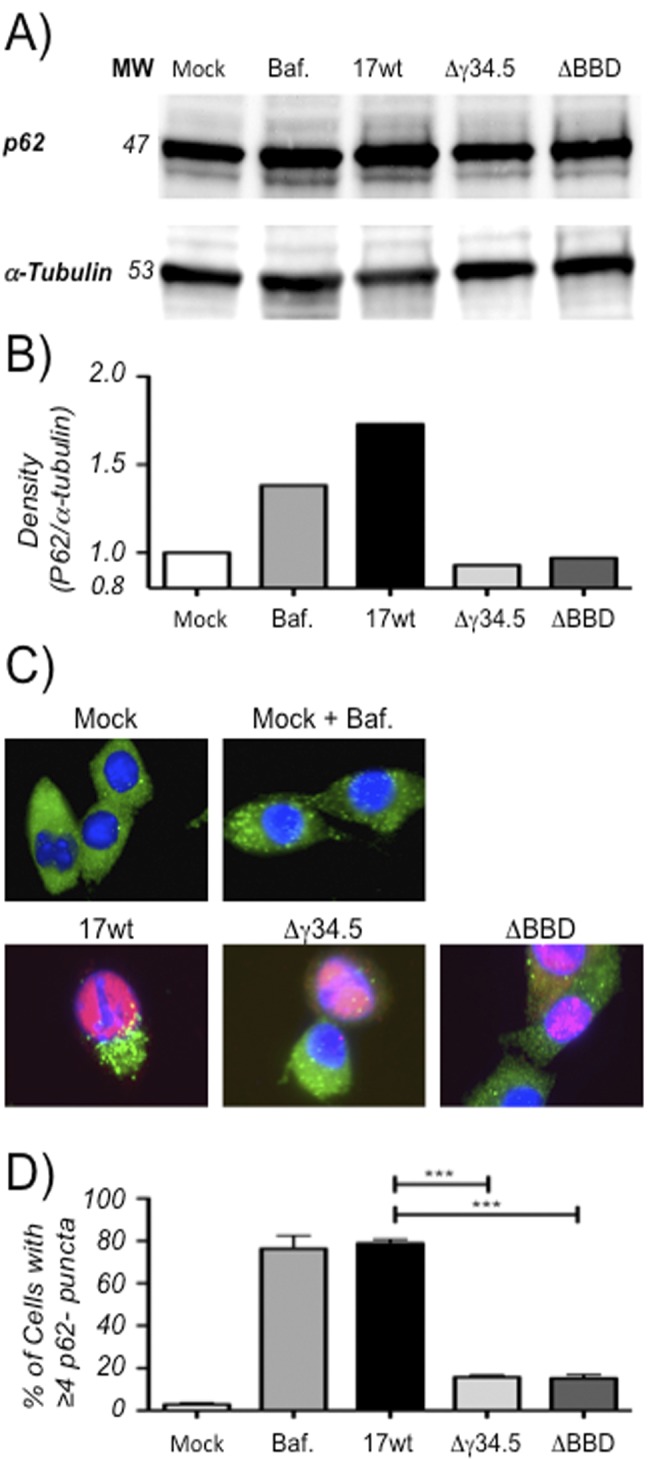
p62 accumulates in DC2.4 cells infected with HSV-1. (A) Representative Western blots (from two experiments) from lysates of DC2.4 cells that were mock infected or infected at an MOI of 8.0 with WT, Δγ34.5, or ΔBBD virus for 8 h and probed with anti-p62 or anti-α-tubulin antibodies. (B) Graph from representative Western blot showing relative band density for p62 normalized to α-tubulin. (C) Immunofluorescence micrographs of cells infected at an MOI of 2.0 with WT, Δγ34.5, or ΔBBD virus for 16 h and probed for p62 and HSV ICP0 expression. (D) Quantification of cells from fluorescence micrographs. Cells displaying 4 or more p62 puncta were counted as positive and graphed as a function of total cells using DAPI for mock-infected cells or as a function of ICP0-positive stain for infected cells. Analysis included at least 60 cells in three or more fields for each treatment in two experiments. Error bars indicate standard deviations between visualized fields. ***, P < 0.001 (t test).