
Figure 3.
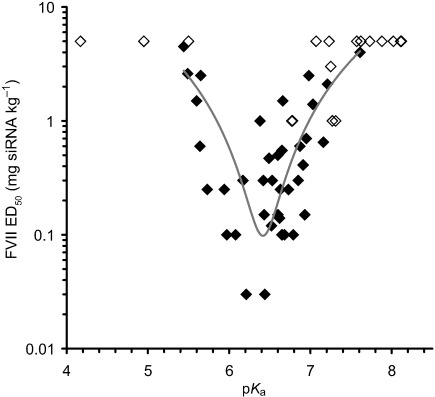
Plot of in vivo hepatic gene silencing activity vs. pKa in mice. The 56 amino lipids were formulated in LNPs and subjected to an ED50 analysis (described in Supporting Information, page 39) and plotted against their pKa. For 15 lipids the ED50 dose was not achieved, these are indicated by the open diamonds representing the highest dose tested for that lipid. For the remaining lipids (closed diamonds), a polynomial best-fit curve highlights the most active compounds, which exhibit an optimal pKa between 6.2 and 6.5. Each data point is derived from a four-dose response curve with groups of n=4 mice per dose.