
Figure 5.
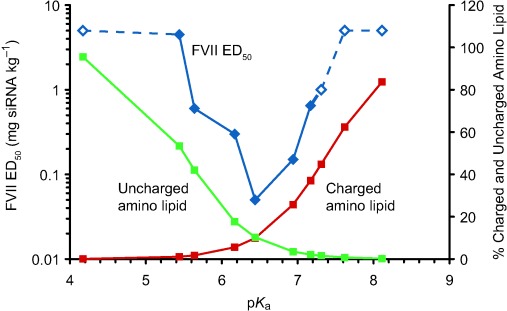
Plot of hepatic gene silencing activity in mice, pKa and calculated protonated/unprotonated amino lipid (% mole fractions) for the set of novel lipids between pKa 4 and 8.5. Each FVII ED50 data point (blue) is derived from a four-dose response (n=4 mice per dose level). Open diamonds represent lipids for which the ED50 was not achieved and are shown at the highest dose tested. The mole % of each amino lipid estimated to carry a positive charge in blood, assuming pH 7.4, is shown in red and the mole % amino lipid estimated to be uncharged in acidified endosomes at pH 5.5 is shown in green.