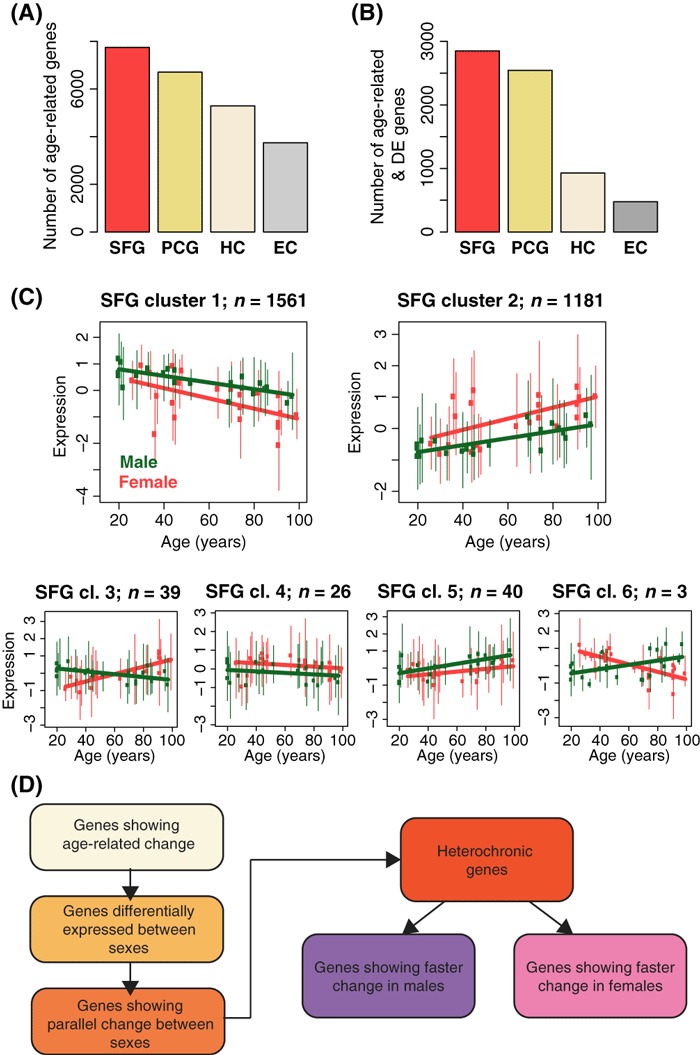
Fig. 1.

Sexually dimorphic gene expression changes in human brain aging. (A) The number of significantly age-related genes in each of the four brain regions. (B) The number of significantly age-related and significantly differentially expressed (DE) genes between two sexes, in each brain region. (C) Genes showing both significant age-related change and significant differential expression between sexes in SFG clustered into six groups using nonsupervised hierarchical clustering. x-axis: age in years; y-axis: male (green) and female (red) SFG expression levels normalized to mean = 0, standard deviation = 1. Points represent the mean per individual among genes within a cluster; vertical lines indicate variation (5–95% range). The number above each panel indicates the number of genes within each cluster. Similar clusters constructed for PCG, HC, and EC are shown in Fig. S2. (D) Schema describing the steps used to identify sexual heterochrony. Each box corresponds to a set of genes defined by a particular test (age-related change: multiple regression; differential expression: ancova; parallel changes: Pearson correlation; heterochrony: DTW-S). For the numbers of genes passing each step, see Table S2.
