
Fig. 3.
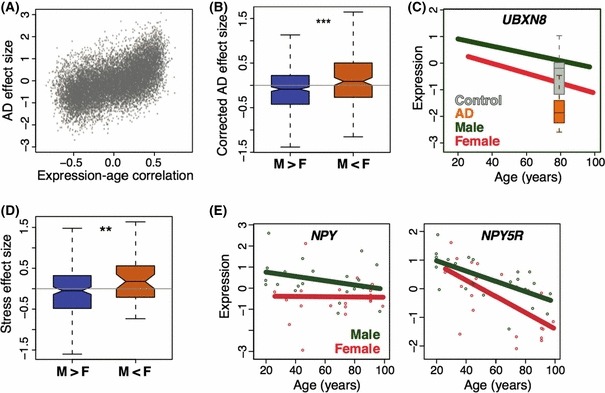
Sex, Alzheimer’s disease, and stress effects on gene expression. (A) Correlation between age-related expression changes and the effect of AD across all expressed genes in SFG. x-axis: Pearson correlation coefficient between expression level and age; y-axis: effect size between AD and control samples. (B) AD effect among female-accelerated genes. The 654 genes showing female-accelerated aging were separated into two groups: those showing higher expression in females /up-regulation during aging (F > M), or lower expression in females /down-regulation during aging (M > F). y-axis: the AD effect size corrected by removing the correlation between the AD and aging effects on expression (Methods). (C) Correlation between AD-related expression effects and sex differences exemplified in the case of UBXN8 (UBX domain protein 8) expression. y-axis: standardized male and female expression levels; x-axis: age in years. The expression levels for the AD and control samples were normalized so that the control individuals have the same mean and standard deviation as age-matched individuals in the SFG dataset. (D) The 654 genes showing accelerated female timing separated into two groups as in panel B. The y-axis shows the stress effect size on gene expression in male monkey VMPFC, based on (Karssen et al., 2007). (E) Neuropeptide Y and Neuropeptide Y5 receptor expression in the SFG.