Fig. 3.

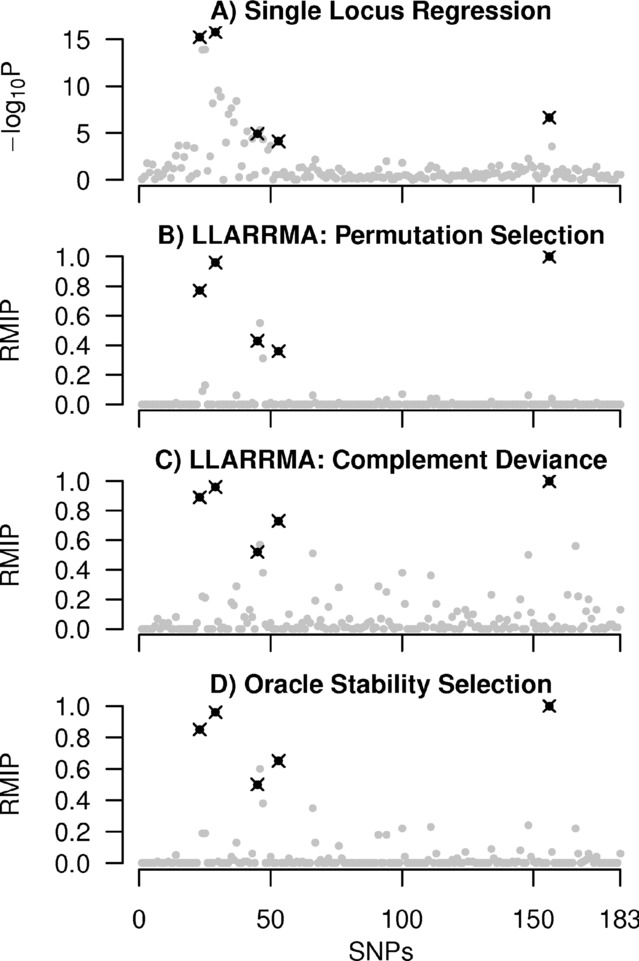
Results of four methods applied to an example case-control dataset from simulation study 1A. Plots show SNP score (logP or RMIP) against SNP location in the cancer data, with true signal SNPs in black and background SNPs in gray.

Results of four methods applied to an example case-control dataset from simulation study 1A. Plots show SNP score (logP or RMIP) against SNP location in the cancer data, with true signal SNPs in black and background SNPs in gray.