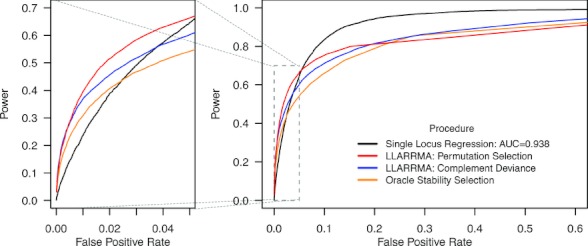
Fig. 4.

Receiver operator characteristic (ROC) curves for simulation study 1A: moderate SNP effects in a hit region of moderate LD. Each curve is based on 1,000 simulations. Right plot shows the full ROC curve; left plot shows a zoomed section focusing on the top-scoring SNPs.
