Fig. 9.

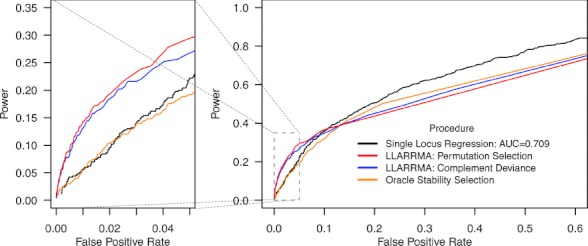
ROC curves for simulation study 2 with 5 true signals: small SNP effects in a hit region of strong LD. Each curve is based on 100 simulations.

ROC curves for simulation study 2 with 5 true signals: small SNP effects in a hit region of strong LD. Each curve is based on 100 simulations.