
Table 2.
Summary of all clusters and power changes in the most frequently affected cortical areas
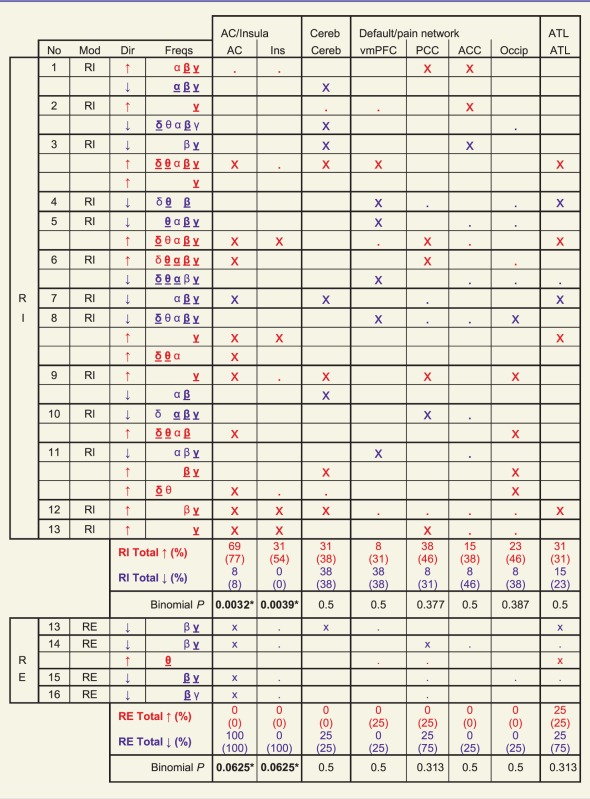 |
Each table row represents one cluster. No = subject number; Mod = type of tinnitus manipulation; Dir = direction of power change for cluster (red and blue text throughout table also denotes power increases and decreases respectively); Freqs = frequency bands covered by clusters (δ = 1.5–4, θ = 4–8, α = 8–12, β = 12–30, γ = 30–150 Hz); bold underlined symbol indicates max T score for frequency band ≥ 2/3 maximum for cluster, standard symbol indicates max T score ≥ 1/3 maximum. ‘x’ for a cortical area indicates max T score in that area ≥ 2/3 maximum for cluster, and ‘.’ indicates max T score ≥ 1/3 maximum for cluster. ‘Total’ rows indicate proportion of residual inhibition or residual excitation subjects showing at least one cluster with max T ≥ 2/3 maximum (open) and ≥1/3 maximum (parentheses) in that cortical area. See Supplementary Fig. 1 for an illustration of all 30 significant clusters in full. AC = auditory cortex; ACC = anterior cingulate cortex or adjacent mesial frontal lobe; ATL = anterior temporal lobe Cereb = cerebellum; Ins = insula; Occip = midline occipital cortex; PCC = posterior cingulate cortex or precuneus; RE = residual excitation; RI = residual inhibition; vmPFC = ventromedial prefrontal cortex.