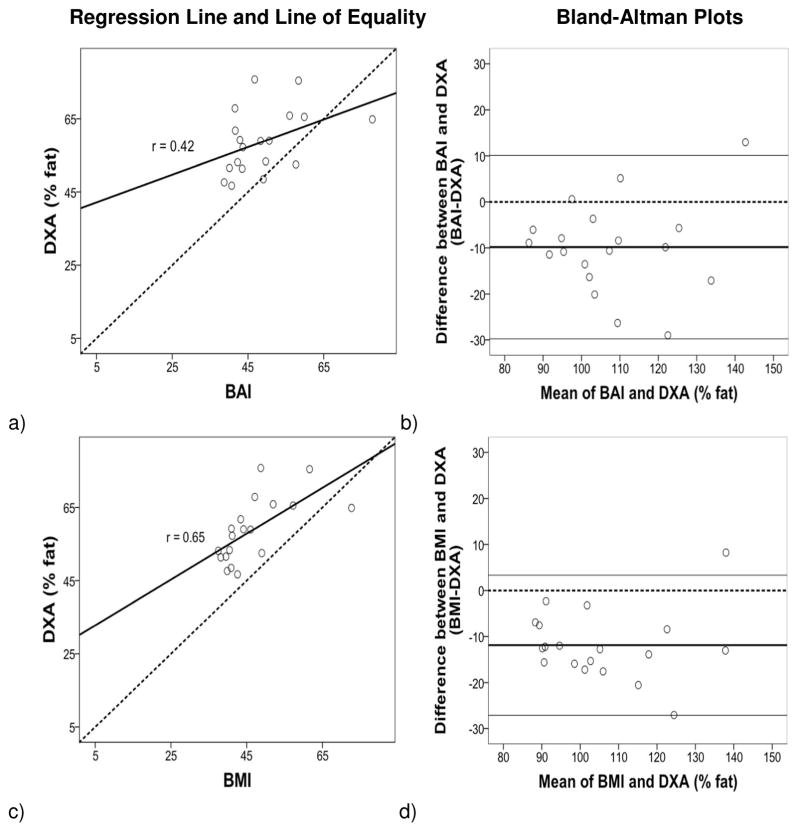
Figure 3.
Regression: Body fat percentage (% fat) from DXA compared with BAI (a, b) and BMI (c, d). The variation (SEE) around the regression lines was greater for BAI comparisons than for BMI comparisons with DXA. Bland-Altman: The 95% confidence interval of limits was greater for BAI comparisons than for BMI comparisons.

