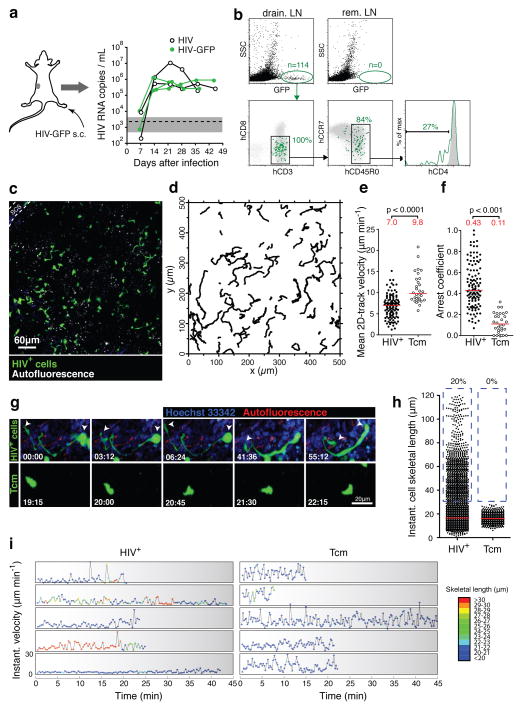
FIGURE 2. In vivo dynamics and phenotype of HIV-infected LN cells.
a. Footpad injection of BLT mice with HIV-GFP produces robust and sustained viremia. ‘HIV’ is identical to HIV-GFP but lacks an IRES-GFP cassette. Similar results as shown here for 5 mice were obtained with other routes of infection (Supplementary Fig. 2d). Dashed line and grey-shaded area indicate mean and 95% confidence interval of background signals obtained from plasma of uninfected mice. b. Draining and non-draining LN cells two days after footpad infection with HIV-GFP. Grey dot plots and histograms show GFP−SSClow LN cells. rem. LN: remote LNs. c. An intravital micrograph recorded from a popLN two days after footpad infection with HIV-GFP. d. Migratory tracks of GFP+ LN cells during a 30-minute recording. e, f. Mean 2D-track velocities (e) and arrest coefficients (f) of HIV+ LN cells compared to uninfected, GFP-expressing Tcm, recorded in LNs of uninfected BLT mice. Lines and numbers indicate medians. Data on HIV-infected LN cells and Tcm are representative of four and two independent experiments, resp. g. MP-IVM time-lapse recordings of an HIV-infected LN cell (top) and an uninfected Tcm (bottom) in BLT LNs. Arrows indicate leading and trailing edge of the infected cell. Elapsed time in min:sec. h. Instantaneous cell skeletal length of HIV-infected LN cells and Tcm from recordings as shown in (g). Lines indicate medians. Percentages indicate events>30 μm, highlighted by dashed blue box. i. Representative traces of infected LN cells and Tcm showing instantaneous cell skeletal length (color-coded) and instantaneous migratory velocity over time. Traces selected from 142 recorded in 4 movies/3 independent experiments.

