Fig. 2.

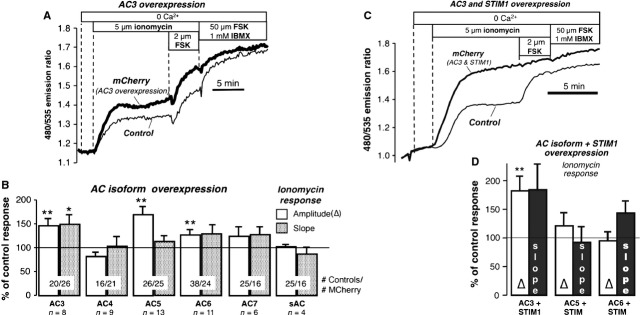
Overexpression of AC isoforms. (A) Overexpression of AC3; response to ionomycin in cells co-transfected with AC3 and mCherry (used as a marker for transfection) and in control cells. (B) Summary of experiments on AC isoforms. Amplitude and slope of the ionomycin response expressed as % of control response. AC3: 8 exp./20 control/26 mCherry cells; AC4: 9 exp./16 control/21 mCherry cells; AC5: 13 exp./26 control/25 mCherry cells; AC6: 11 exp./38 control/24 mCherry cells; AC7: 6 exp./25 control/16 mCherry cells; sAC: 4 exp./11 control/10 mCherry cells. (C) Effect of co-expression of AC3 and STIM1 on the response to ionomycin. (D) Summary of results of overexpression of AC isoforms and STIM1. The response to ionomycin is expressed as % of the response in control cells. AC3+ STIM1: 6 exp./22control/8 mCherry cells; AC5+ STIM1: 8 exp./8 control/8 mCherry cells; AC6+ STIM1: 10 exp./18 control/14 mCherry cells. *P < 0.05, **P < 0.02, ***P < 0.01.
