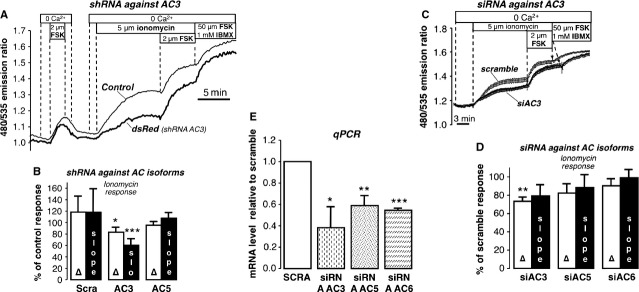
Fig. 3.

Effect of knockdown of AC isoforms. (A) Response to ionomycin in cells expressing shRNA against AC3; dsRed was used as a marker for transfection with shRNA. (B) Summary of experiments in cells expressing dsRed and shRNA against AC3 (13 exp./16 cells), AC5 (Δ: 7 exp., 12 cells; slope: 6 exp./11 cells), and treated with scramble (Δ: 10 exp./16 cells; slope: 9 exp./15 cells). Amplitude and slope of ionomycin response are expressed as % of control response. (C) Response to ionomycin in cells treated with siRNA for AC3 compared with cells treated with scramble (average of 14 scramble and 12 dsRed cells) (D) Summary of experiments with cells treated with siRNA for AC3 (6 exp./80 cells), AC5 (7 exp./68 cells) and AC6 (8 exp./91 cells) expressed as % of the response in scramble cells (scramble controls for siAC3 and siAC5: 13 exp./126 cells; scramble controls for siAC6 16 exp./202 cells). (E) Summary of qPCR experiments. siRNA AC3: 3 independent experimental samples; siRNA AC5: 3 exp.; siRNA AC6: 2 exp. *P < 0.05; **P < 0.01; ***P < 0.001.
