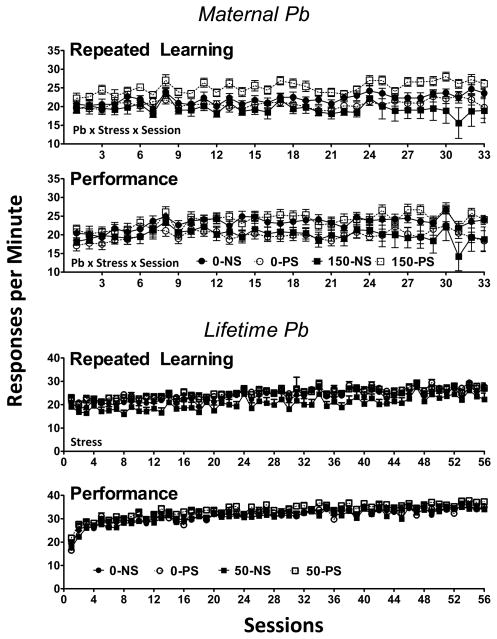
Figure 3.
Group mean ± S.E. response rates (responses per minute) values during the repeated leaning and performance components of the multiple schedule across sessions for maternal Pb and PS (Top two panels) and lifetime Pb and PS (bottom two panels). Sample sizes and conditions are as described for Figures 1 and 2. Pb x stress x session = interaction from the repeated measures ANOVA. Stress = main effect of PS from the repeated measures ANOVA. Pb x stress x session = interaction from the repeated measures ANOVA.

