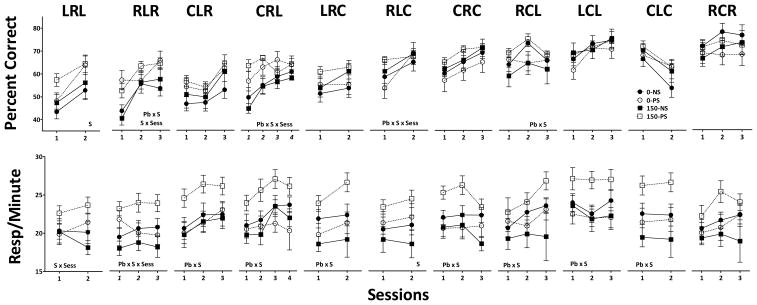
Figure 4.
Group mean ± S.E. values for percent correct (top) and for response per minute values averaged over RL1 and RL2 over the presentations of each of the RL sequences, as identified, over the course of testing on the multiple RL and P schedule for maternal Pb and PS. Sequences are arranged in order from left to right of ascending percent correct levels (hardest to easiest) of the 0-NS group on session one. Corresponding response rate values are shown in the bottom row. Sample sizes are as described in Figure 1. S=main effect of PS, Pb x S=interaction of Pb by PS, S x Session=interaction of PS by session; Pb x S x session= interaction of Pb by PS by session in repeated measures ANOVA.

