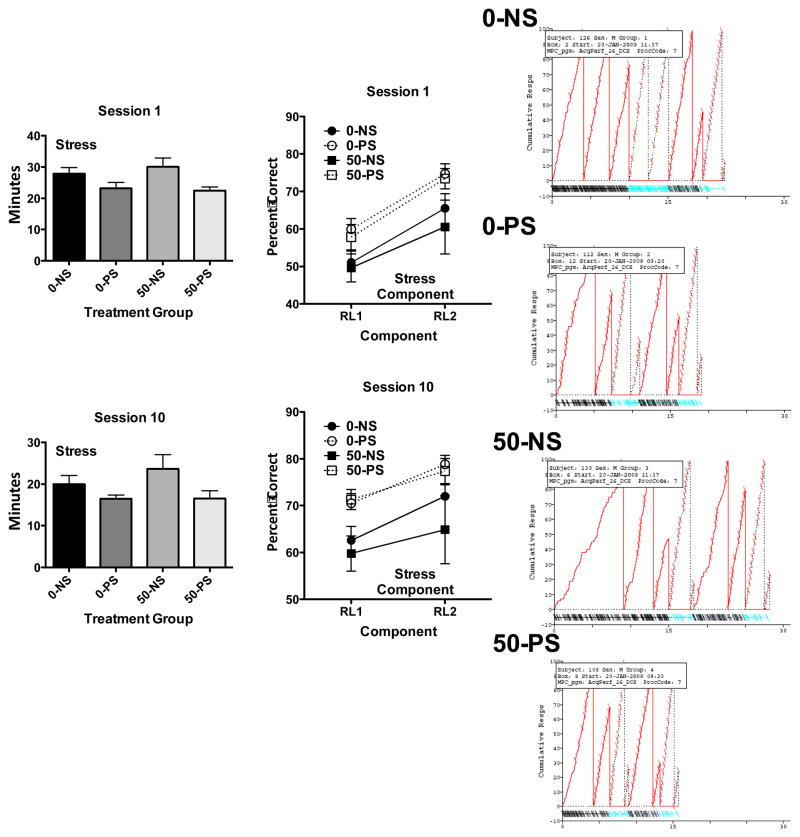
Figure 8.
Left: Group mean ± S.E. values for session length (min) for session 1 (top) and session 10 (bottom) of sequence RCL during the multiple schedule for lifetime Pb-exposed treatment groups. Middle: Group mean ± S.E. values for percent correct from RL1 to RL2 for session 1 (top) and session 10 (bottom) for sequence RCL during the multiple schedule for lifetime Pb-exposed treatment groups. Right: Representative cumulative records from session 10 of sequence RCL. Responses cumulate vertically to 100 at which point the pen resets. RL components are indicated by solid line resets; P components by dashed line resets. Pips indicate each reinforcement delivery for correct completion of a sequence. The bottom tracing shows errors during each of the components.

