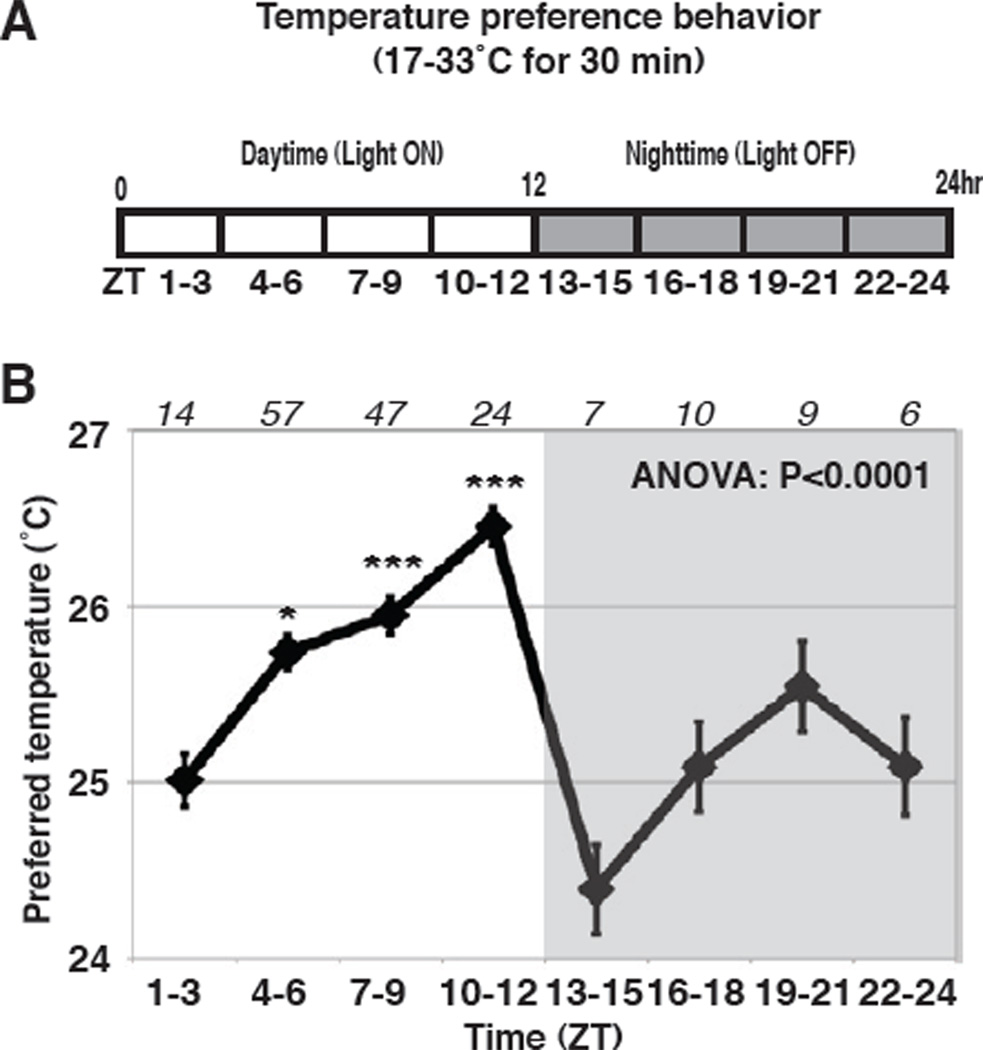
Figure 1. Fly’s temperature preference is rhythmic over the course of a day.
(A) Schematic of experimental condition. Temperature preference behavior assays were performed for 30 min in each of the eight different time zones (ZT 1–3, 4–6, 7–9, 10–12, 13–15, 16–18, 19–21 and 22–24). Zeitgeber Time (ZT) (12h light/dark cycle; ZT0 is lightson, ZT12 is lights-off). (B) TPR of w1118 flies over 24 hrs. Preferred temperatures were calculated using the distribution of flies in temperature preference behavior (Figure S1). Data are shown as the mean preferred temperature in each time zone. Numbers represent the number of assays. ANOVA, P<0.0001. Tukey-Kramer test compared to ZT1–3, ***P<0.001, **P<0.01 or *P<0.05. By Tukey-Kramer test, compared to ZT13–15, the preferred temperature at ZT4–6, 7–9, 10–12 (P<0.001) and ZT19–21 (P<0.05) were statistically significant (see Table S1).

