Figure 5.
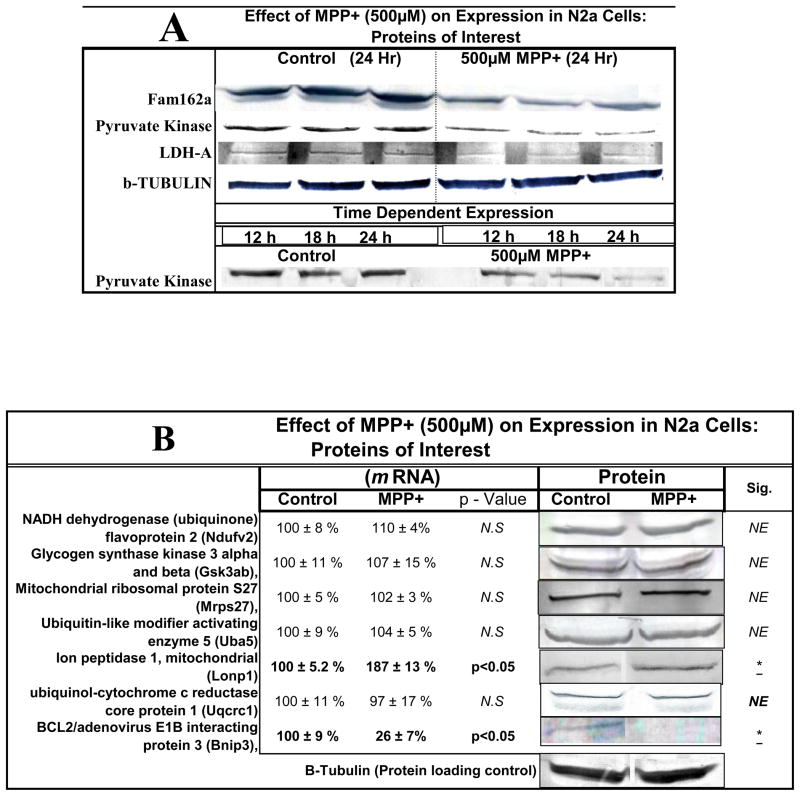
Figure 5A. Relative protein expression for basic proteins of interest in N2a ± 500μM MPP+ at 12–24 Hours.
Figure 5B. Variable mRNA and expression profiles for proteins of interest in N2a cells treated ± MPP+ [500μM ] at 24 Hr. The data represent mRNA (normalized g processed signal) % Ctrl (Left) presented as the Mean ± S.E.M., n=3. Significance of difference between the control and treatment groups were determined by a students t-test * p<0.05. Corresponding western blots displaying protein expression (Right).

