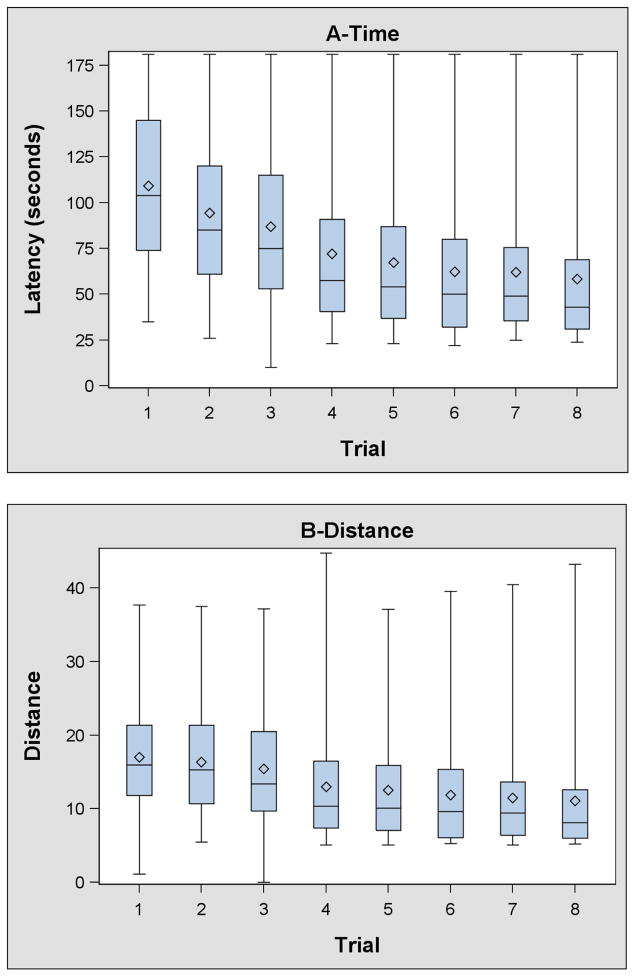
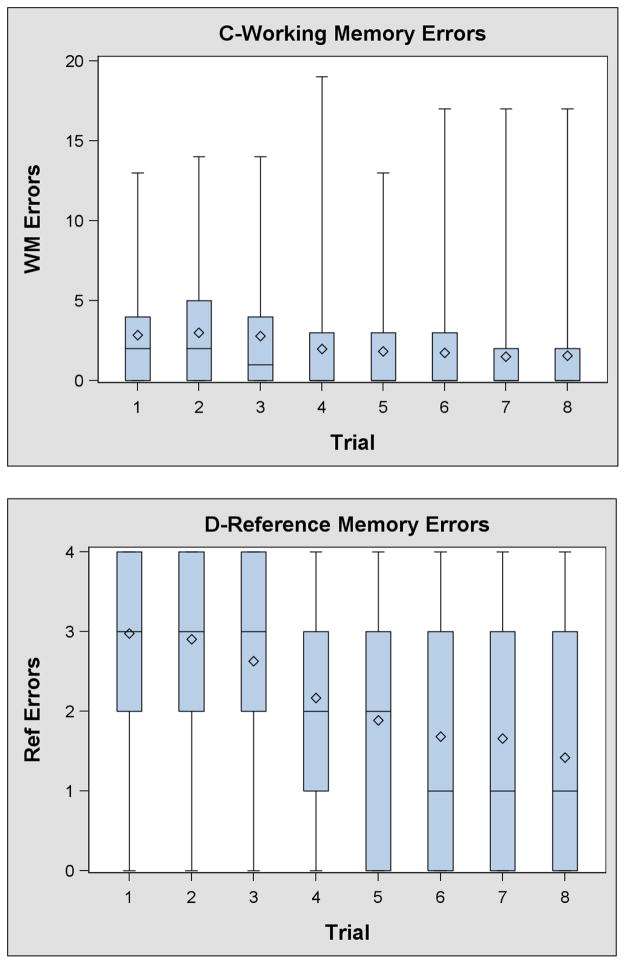
Figure 2.
Box and whisker plots of VRAM time, distance, working memory errors, and reference memory errors.*
*- Whiskers represent the minimum and maximum. The bottom and top of the box represents the 25th and 75th percentiles, respectively. The lines in the box represent the median. The diamond represents the mean.


