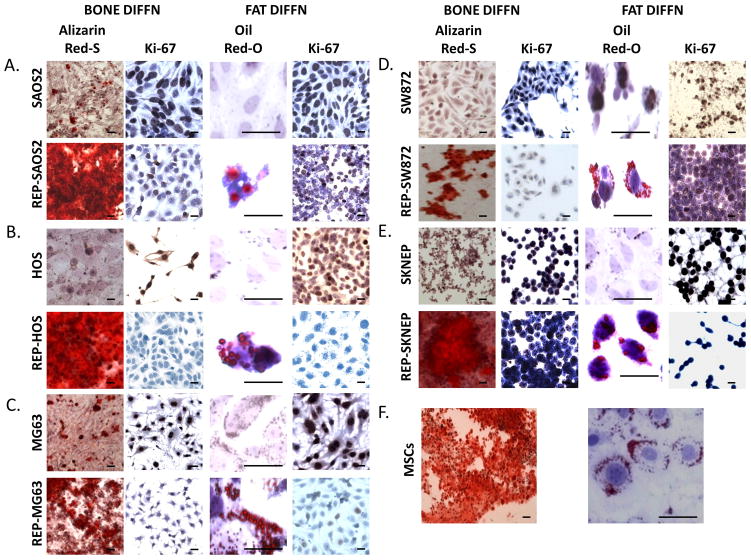
Figure 2.
(A–E) Comparison of sarcomas and reprogrammed-sarcomas in terms of achieving terminal differentiation as measured by acquisition of the terminal phenotype (both bone via Alizarin Red S staining for calcium deposition and fat via Oil-Red-O staining for lipid accumulation) AND cessation of proliferation via loss of Ki67. (F) MSCs differentiated as controls into bone and fat. (Oil-Red-O images are magnified 10-fold to accentuate lipid formation associated with each cell). Scale bars=10um.

