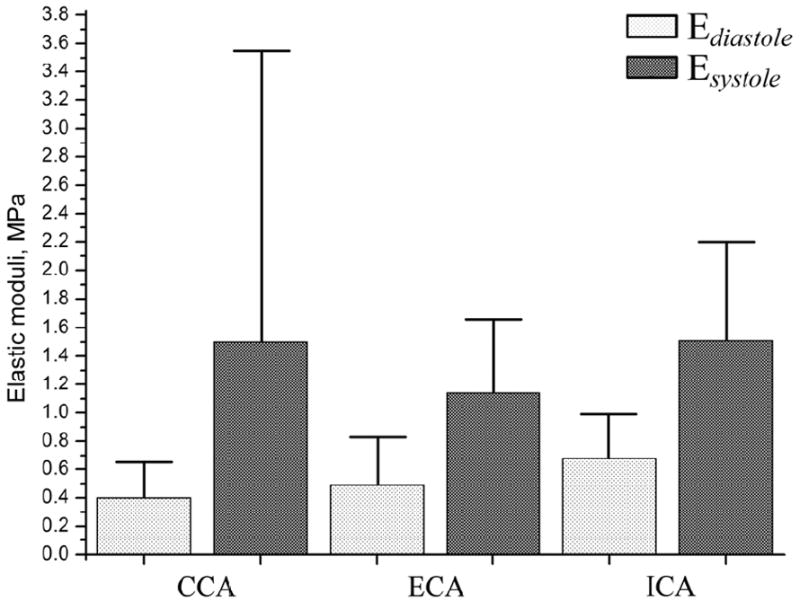
Figure 4.

Mean values (vertical bars) and standard deviations (vertical T-lines) of tangent elastic moduli Ediastole and Esystole calculated for two portions of the stress-strain curve (see Figure 2) for CCA, ECA and ICA. The data presented in this figure is a graphical representation of results summarized in Table 2. Light bars represent moduli at end-diastole while darker bars represent moduli at peak-systole.
