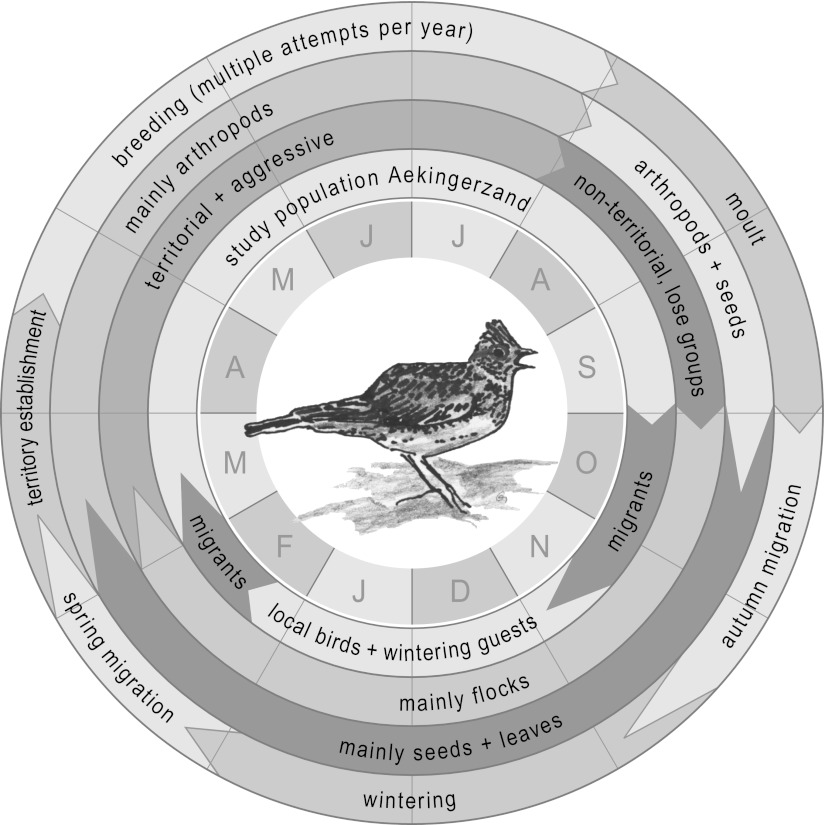
Fig. 1.
The annual cycle of a skylark (Alauda arvensis) in the northern Netherlands. Length of arrows in the transition between two stages indicates the amount of variability between years and/or individuals. Data on diet are based on Green (1978), Donald et al. (2001) and Geiger et al. (in preparation). All other data are based on our own unpublished data and Hegemann et al. (2010)

