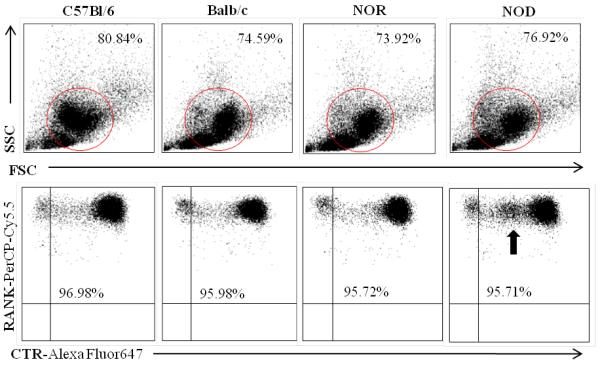
Figure 1. Flow cytometric analysis of osteoclast culture purity.

BM-OCs were stimulated with RANK-L for 72hrs on UpCell plates. Cells were probed for RANK (PerCP-Cy5.5) and calcitonin receptor [CTR] (AlexaFluor647) and acquired using a FACSCalibur flow cytometer. FCS Express software was used to determine forward and side scatter population of analyzed BM-OCs (circled in upper panel) and percentage of pure RANK+CTR+ BM-OCs (lower panel). Black arrow indicates novel population of RANK+ cells expressing low levels of CTR [RANK+CTRlo] NOD BM-OCs. Data shown as representative scatter plots of each mouse strain.
