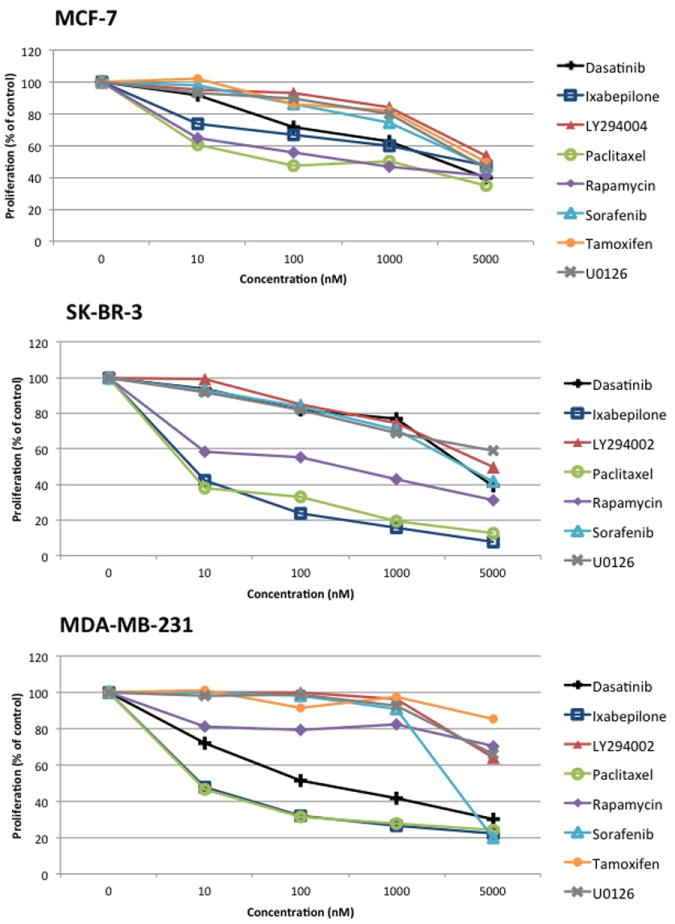
Figure 1. MTT assay of MDA-MB-231, MCF-7, and SK-BR-3 cells treated with single drugs for 48 hours.

Percent proliferation is calculated relative to untreated controls. Data points represent averages from triplicates from a representative experiment, which were done at least three times independently.
