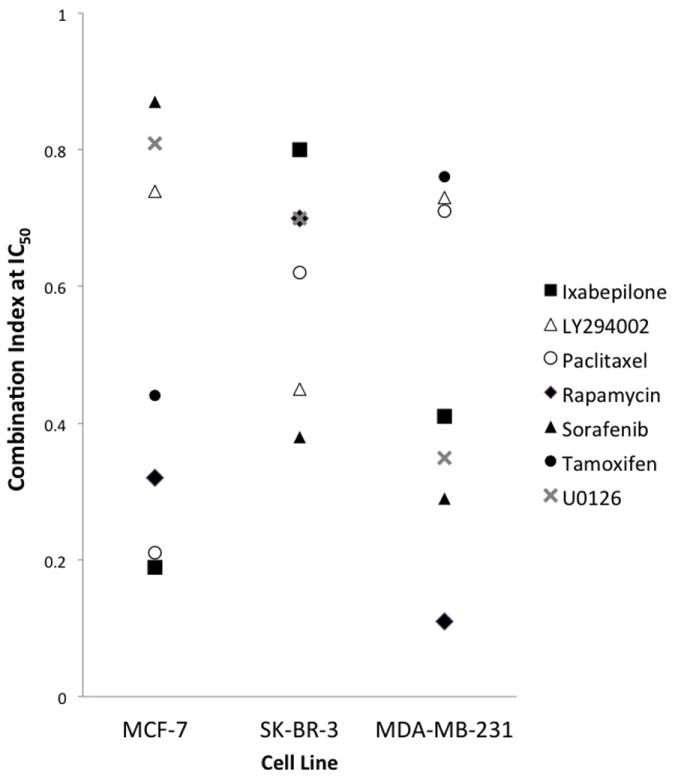
Figure 3. Compilation of CI values @ IC50 for different drug combinations in MCF-7, MB-231, and SK-BR-3 cells.

The CI values provide the following interpretations: <0.1 very strong synergism; 0.1 to 0.3 strong synergism, 0.3 to 0.7 synergism, 0.7 to 0.85 moderate synergism, 0.85 to 0.9 slight synergism, 0.9 to 1.10 nearly additive.
