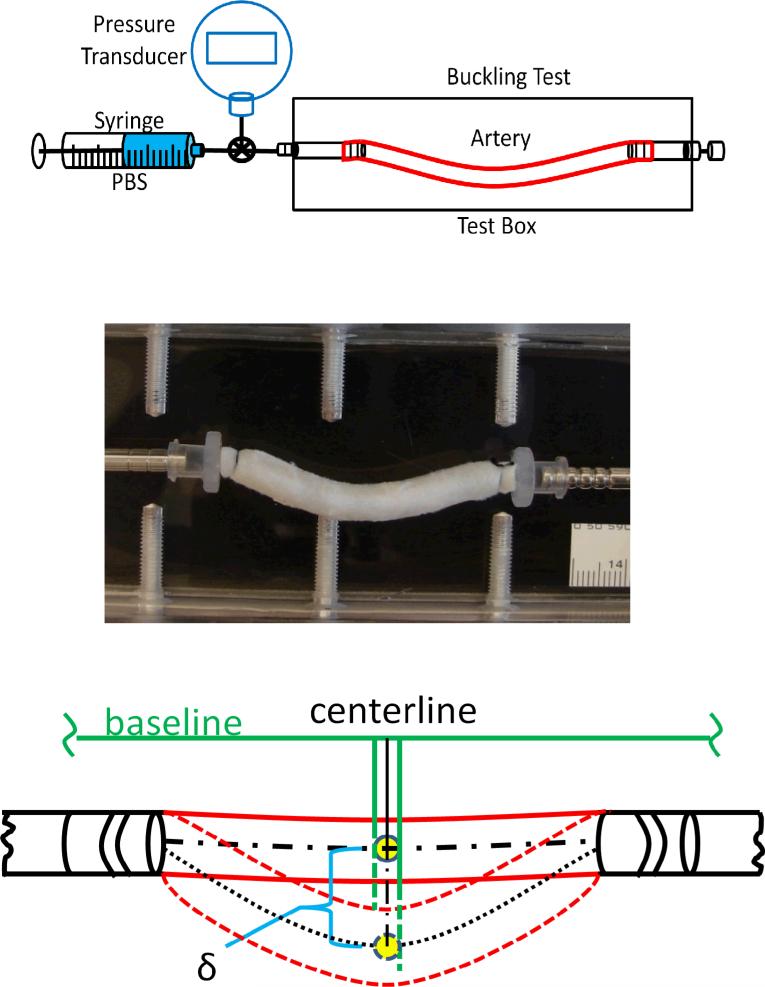
Figure 2.
Top: Schematics of experimental setup for artery buckling test. Arteries are cannulated at both ends, stretched to given axial stretch ratios, and pressurized with a syringe pump. Middle: An artery buckles at a pressure of 60 mmHg (postbuckling). Bottom: Schematics illustrating the measurement of deflection (δ) of centerline of a buckled artery.

