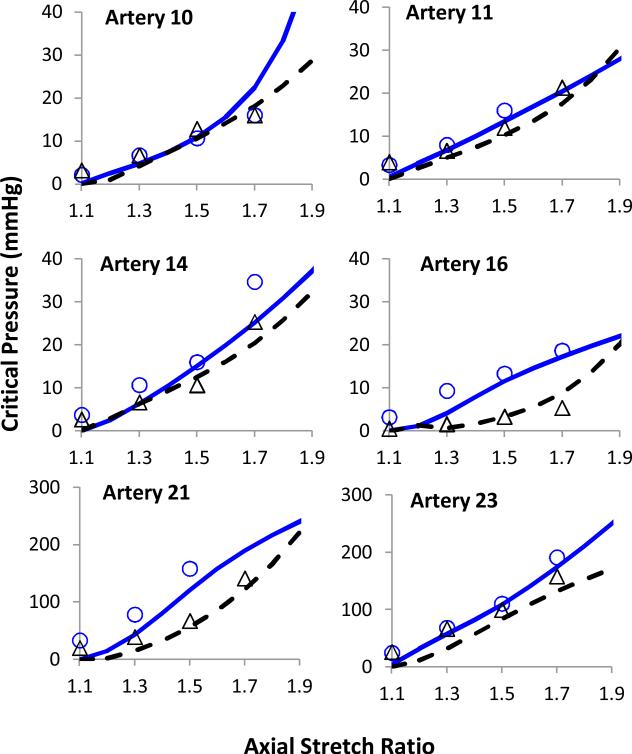
Figure 6.
Model predicted critical pressures compared with experimental data for two representing arteries each in group I (64U/ml, Top), group II (128U/ml, Middle), and group III (400U/ml, bottom) The hollow and solid symbols represent data pre- and post- treatment, respectively. The solid and dotted lines represent the model predicted curves before and after collagenase treatments, respectively.

