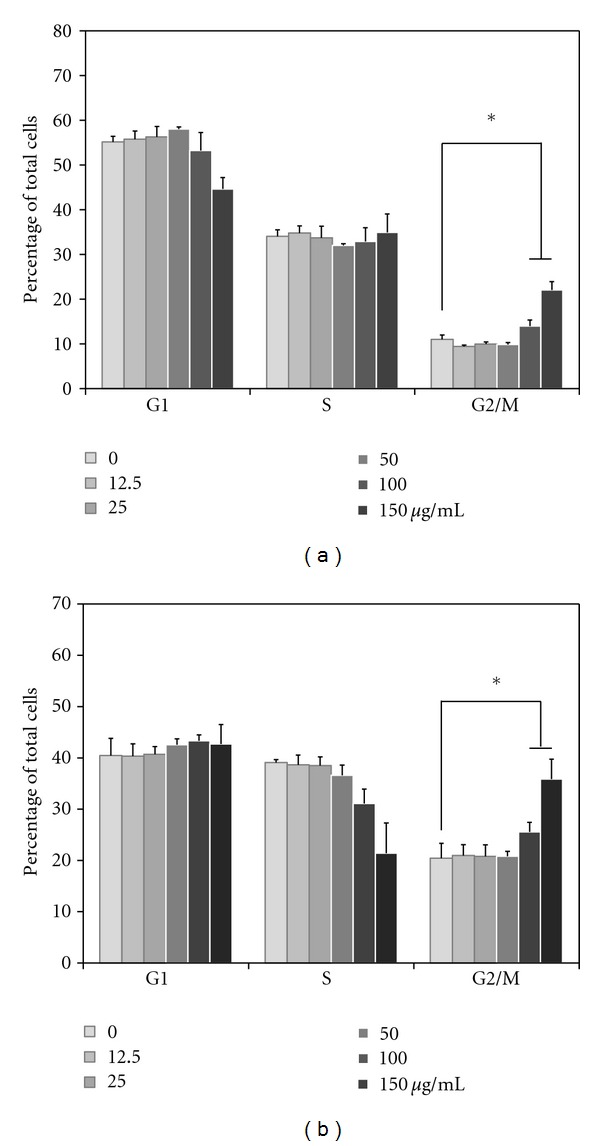
Figure 2.

Cell cycle analysis of LCSP-treated CRC cells. Cells were treated with increasing concentrations of LCSP as indicated and then incubated at 37°C for 24 h. Cells were harvested and fixed in 70% alcohol and then stained with propidium. Stained cells were analyzed using a flow cytometer and the distributions in each cell cycle phase of Colo320DM (a) and SW480 (b) were determined using Modfit software. Data are expressed as a percentage of total cells, represent the averages of three independent experiments, and are expressed as the mean ± SD. *R`epresents a significant difference (P < 0.05).
