Figure 5.

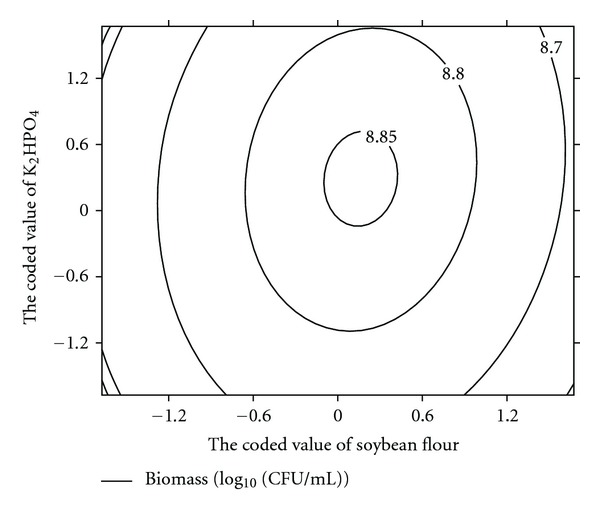
Contour plot for DNS32 strain production as a function of X2 (soybean concentration) and X3 (K2HPO4 flour concentration) when the coded value of X1 (corn flour concentration) was fixed at 0.

Contour plot for DNS32 strain production as a function of X2 (soybean concentration) and X3 (K2HPO4 flour concentration) when the coded value of X1 (corn flour concentration) was fixed at 0.