
Figure 1.
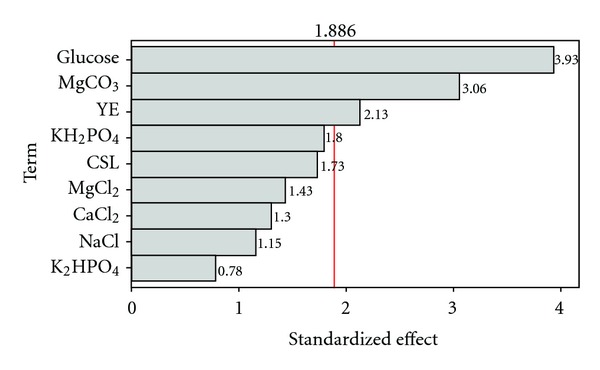
Pareto chart of standardized effects on the succinic acid production. The chart includes a vertical line (i.e., standardized effect = 1.886) at the critical t-value for α of 0.20. The bars are displayed in order of the size of the effects, and the standardized effect of each term was shown on the top of its corresponding bar.