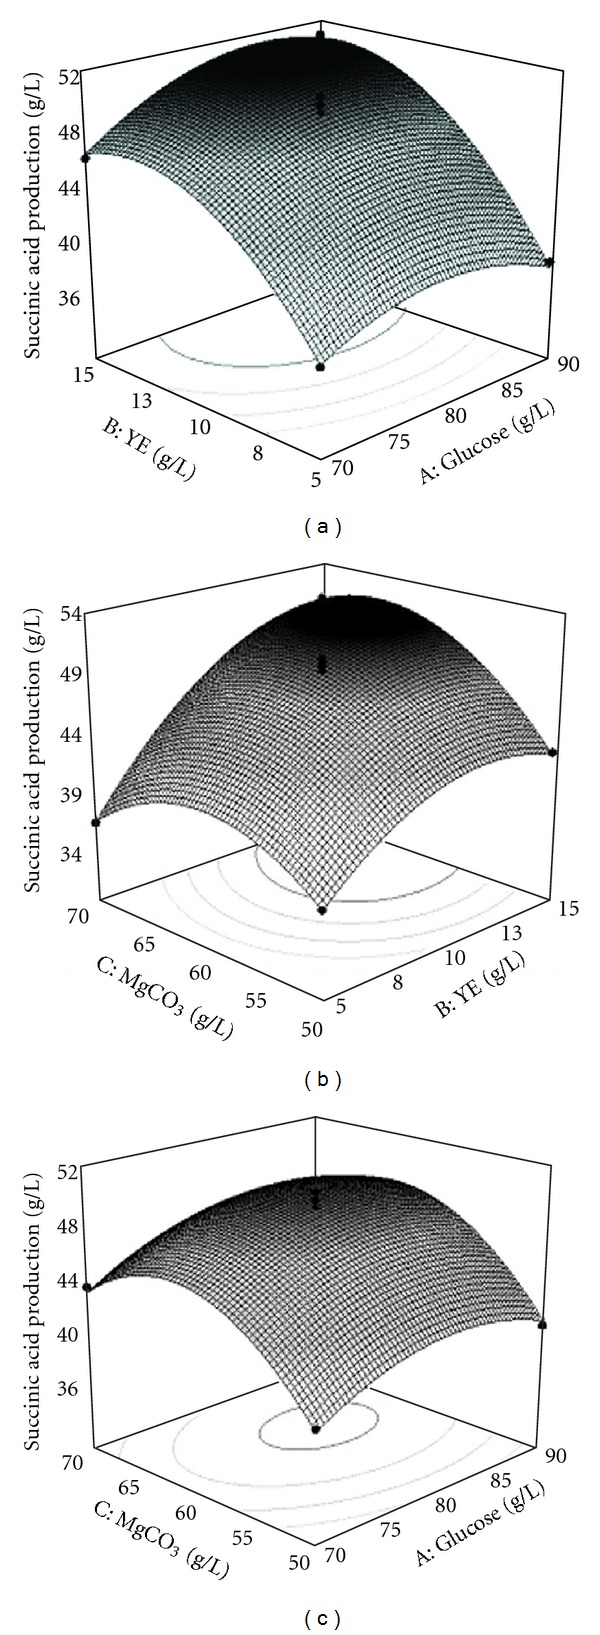
Figure 2.

Response surface curve for the succinic acid production by Actinobacillus succinogenes ATCC 55618 showing the combination effects of (a) glucose and yeast extract, (b) yeast extract and MgCO3, and (c) glucose and MgCO3. Other factors are constant at zero levels.
