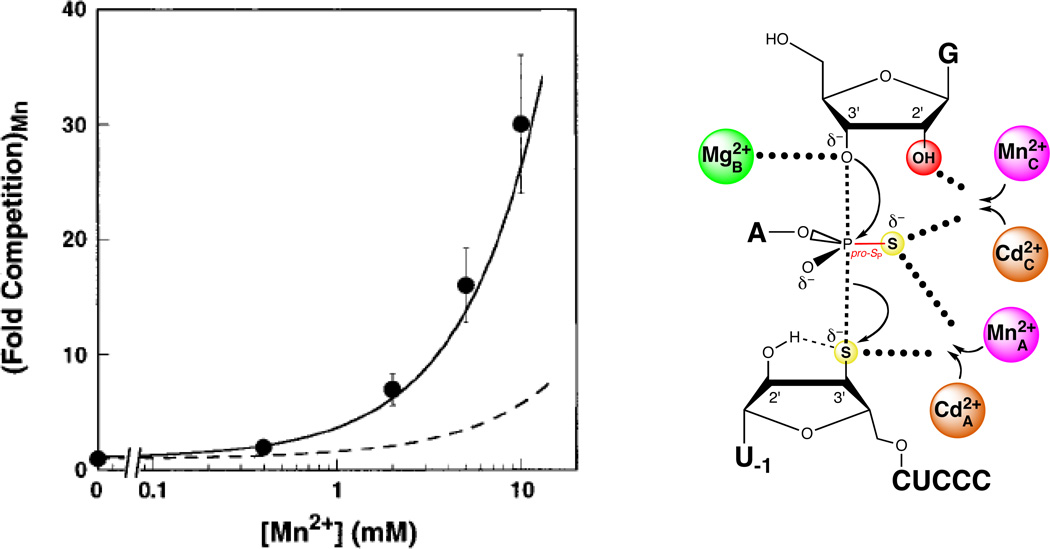
Figure 12.
Mn2+ ions compete with Cd2+ ions for sites A and C during rescue of the S3’S,P-S reaction. In the plot at left, the data are represented as filled spheres. The solid line shows the degree of competition expected from Mn2+ ions competing at sites A and C, while the dashed line shows the corresponding model for Mn2+ competition at sites A and B. [Data taken from (124).]

