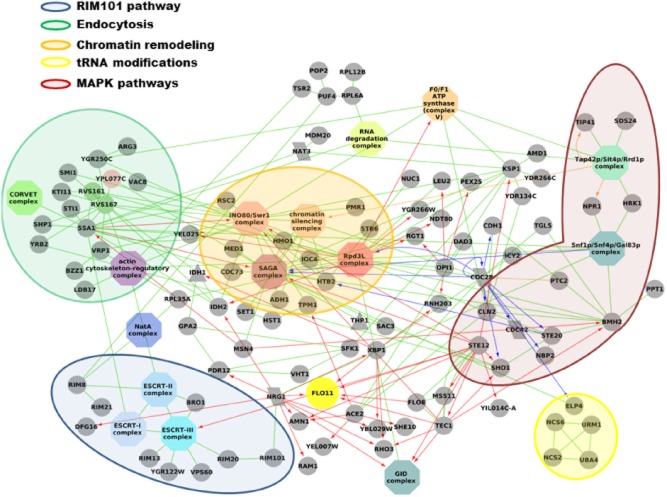
Fig. 2.
Physical interaction network visualization of genes involved in colony morphology. Genes with mutations resulting in altered colony morphology are mapped onto a physical interaction network as round nodes. To improve clarity, protein complexes containing more than 2 genes are visualized as single coloured octagonal nodes. Small protein complexes containing genes associated with colony morphology are complemented with their corresponding gene members which were not directly associated with altered colony morphology, these are visualized as a parallelogram if the mutation of this gene is lethal, or as a triangle if the mutation resulted in decreased fitness. FLO11 is indicated as a large round yellow node. The edges between the nodes indicate physical interactions and specifically green edges indicate protein–protein interactions, blue phosphorylation interactions, orange de-phosphorylation interactions and red protein–DNA interactions. The direction if applicable for an interaction is indicated with an arrow. Genes with mutations resulting in altered colony morphology which are not connected to other smooth/semi-smooth genes or associated complexes are omitted from this figure.

