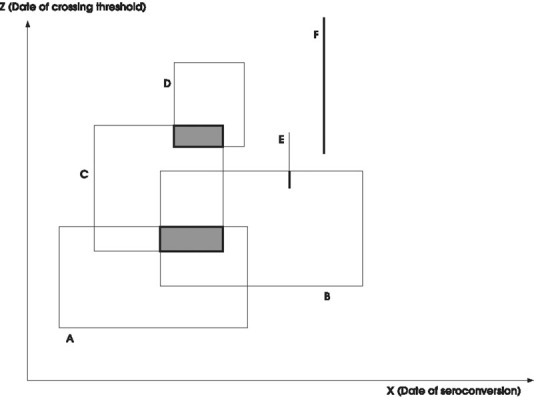
Figure 2.

Illustration of 6 individuals with unknown date of seroconversion and unknown date of crossing threshold. Each rectangle represents the region in which the point (x, z) is known to lie for that individual. The shaded areas show the regions where all the mass of the NPMLE estimate lies.
