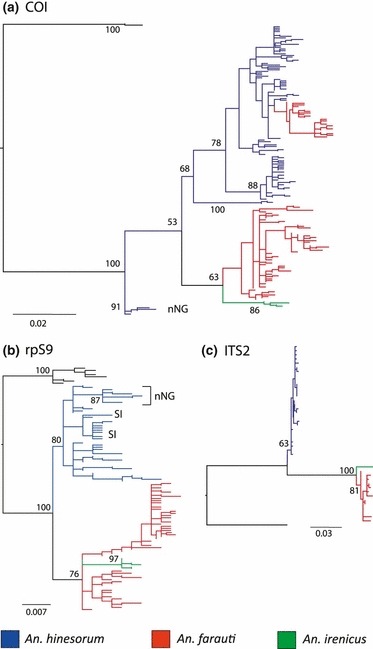
Fig. 3.

Maximum likelihood phylogenies of: (a) COI, (b) rpS9 and (c) ITS2. Duplicate sequences were removed prior to the generation of phylogenies. Branches are coloured by species [red = Anopheles farauti, blue = An. hinesorum, green = An. irenicus, black = An. koliensis (outgroup)]. Support values on nodes are percentages out of 1000 bootstraps; scale bar is in units of number of nucleotide substitutions per site, nNG, northern New Guinea.
