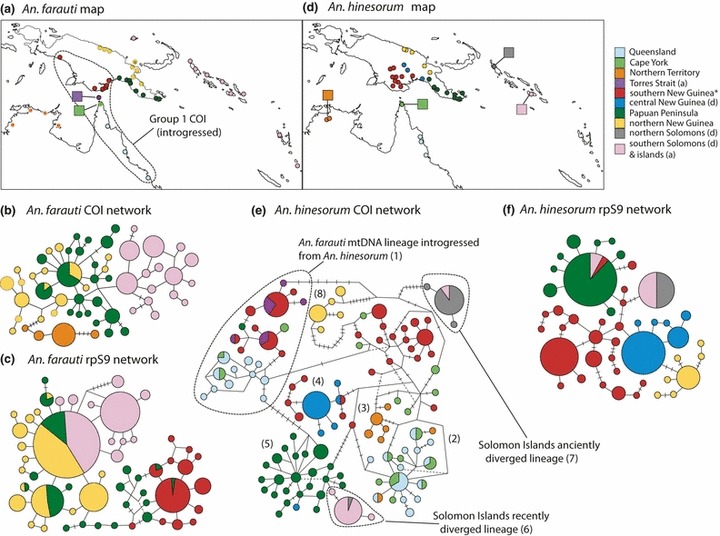
Fig. 5.

Maximum parsimony haplotype networks of Anopheles farauti and An. hinesorum at COI and rpS9 loci. Circles represent haplotypes and the size of circles is relative to the number of individuals per haplotype. Lines between haplotypes represent a single mutational change, as do dashes across lines, bends and intersections. Colours indicate sampling locality of haplotypes (i.e. geographic region), see maps and legend for details. The An. farauti lineage containing mtDNA introgressed from An. hinesorum is shown in the An. hinesorum network (Group 1 in e).
