
Fig. 6.
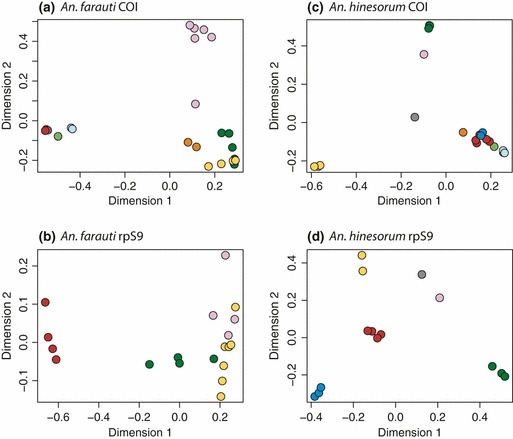
Multidimensional scaling plots of pairwise FST values. Each point represents a sampling site and distances between points are relative to FST values. Sites are coloured by geographical region, consistent with maps presented throughout.
Official websites use .gov
A
.gov website belongs to an official
government organization in the United States.
Secure .gov websites use HTTPS
A lock (
) or https:// means you've safely
connected to the .gov website. Share sensitive
information only on official, secure websites.
Multidimensional scaling plots of pairwise FST values. Each point represents a sampling site and distances between points are relative to FST values. Sites are coloured by geographical region, consistent with maps presented throughout.